
A particle of mass falls from rest through a resistive medium having resistive force , where is the velocity of the particle and is a constant. Which of the following graphs represents velocity versus time ?
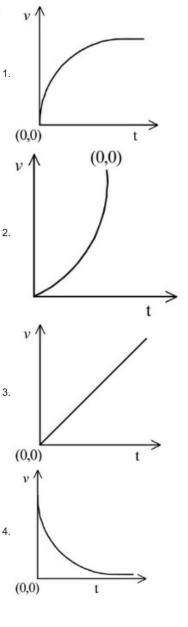
- A
Graph 1
- B
Graph 2
- C
Graph 3
- D
Graph 4
A particle of mass falls from rest through a resistive medium having resistive force , where is the velocity of the particle and is a constant. Which of the following graphs represents velocity versus time ?
Graph 1
Graph 2
Graph 3
Graph 4
Correct answer:A
Standard Method
Given: A particle of mass falls from rest in a resistive medium with resistive force .
Find: Which graph correctly represents versus .
For downward motion, take downward direction as positive. Then the forces are weight downward and resistive force upward.
So, the equation of motion is
Rearranging,
This is a first-order linear differential equation.
Using the integrating factor,
we get the solution
Now analyze the result:
Therefore, velocity increases from zero, rises rapidly at first, and then gradually levels off toward a horizontal asymptote.
So the correct graph is the one that starts at the origin and approaches a constant value asymptotically. Graph 1 matches this behavior.
Therefore, the correct option is A.
Behavior of the velocity-time curve
Given: Resistive force is proportional to velocity.
Find: The qualitative shape of the - graph.
Whenever the resistive force is proportional to speed, the net downward force decreases as increases. Hence the acceleration is not constant.
Initially, when ,
so the particle begins with maximum acceleration.
As time increases, increases, so
becomes smaller and smaller.
Thus the slope of the - graph decreases continuously, and eventually becomes nearly zero when terminal velocity is approached.
This rules out:
Hence the only correct graph is Graph 1, so the correct option is A.
Assuming the acceleration remains constant at throughout the motion. This is wrong because the resistive force increases with speed and reduces the net force. Instead, use and note that the slope of the graph must decrease with time.
Choosing the straight-line graph by comparing with free fall in vacuum. This is wrong because linear increase of with occurs only when there is no resistive force. Here the speed approaches terminal velocity asymptotically.
Ignoring the initial condition that the particle falls from rest. This is wrong because the correct graph must start from at . Any graph not starting at the origin is inconsistent with the given condition.
Get unlimited AI-adaptive practice, mastery tracking, and an AI tutor that explains every step — free to start.