For bacterial growth in a cell culture, growth law is very similar to the law of radioactive decay. Which of the following graphs is most suitable to represent bacterial colony growth? Where - Number of Bacteria at any time, - Initial number of Bacteria.
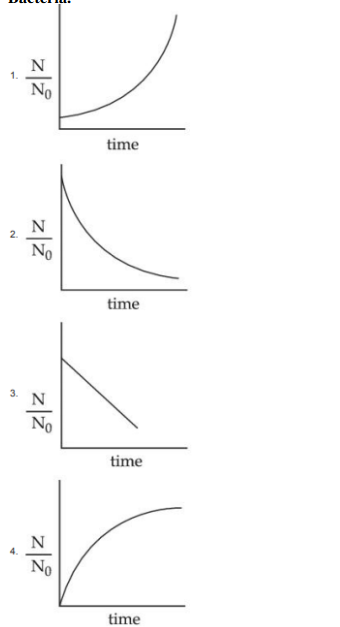
- A
Graph 1
- B
Graph 2
- C
Graph 3
- D
Graph 4
