MCQMediumJEE 2026Rate of Reaction

JEE Chemistry 2026 Question with Solution

ADA \rightarrow D is an endothermic reaction occurring in three elementary steps:

(i) ABΔHi=+veA \rightarrow B \quad \Delta H_i = +\text{ve}

(ii) BCΔHii=veB \rightarrow C \quad \Delta H_{ii} = -\text{ve}

(iii) CDΔHiii=veC \rightarrow D \quad \Delta H_{iii} = -\text{ve}

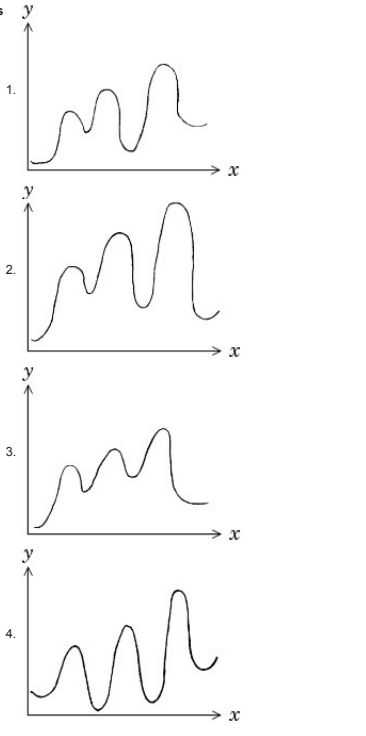
Which of the following graphs between potential energy (y-axis) versus reaction coordinate (x-axis) correctly represents the reaction profile of ADA \rightarrow D?

Four reaction profile graphs labeled 1 to 4, each plotting potential energy on y-axis versus reaction coordinate on x-axis with three peaks and different final energy levels.
  • A

    Graph 1

  • B

    Graph 2

  • C

    Graph 3

  • D

    Graph 4

Answer

Correct answer:B

Step-by-step solution

Standard Method

Given: ADA \rightarrow D is endothermic and occurs in three elementary steps:

  • ABA \rightarrow B with ΔHi=+ve\Delta H_i = +\text{ve}
  • BCB \rightarrow C with ΔHii=ve\Delta H_{ii} = -\text{ve}
  • CDC \rightarrow D with ΔHiii=ve\Delta H_{iii} = -\text{ve}

Find: The correct potential energy versus reaction coordinate graph.

For a multistep reaction, the number of elementary steps equals the number of transition states, so the graph must contain three peaks.

Since the overall reaction ADA \rightarrow D is endothermic, the final energy of DD must be higher than the initial energy of AA.

Now analyse each step:

  • In step (i), ΔHi=+ve\Delta H_i = +\text{ve}, so BB lies at a higher energy level than AA.
  • In step (ii), ΔHii=ve\Delta H_{ii} = -\text{ve}, so CC lies at a lower energy level than BB.
  • In step (iii), ΔHiii=ve\Delta H_{iii} = -\text{ve}, so DD lies at a lower energy level than CC.

Thus the intermediate energy pattern is:

ABCDA \uparrow B \downarrow C \downarrow D

with the additional condition that the final level of DD is still above that of AA.

So the correct graph must show:

  • three maxima,
  • an initial rise from AA to BB,
  • then decreasing intermediate levels from BB to CC to DD,
  • and the final point higher than the starting point.

Among the given graphs, Graph 2 satisfies all these conditions.

Therefore, the correct option is B.

Why Graph 2 Matches

Given: A three-step endothermic reaction profile is to be identified.

Find: Which graph matches the signs of the step enthalpies and the overall enthalpy change.

Use these observations one by one:

  1. Three elementary steps mean three activated complexes, so the profile must have three peaks.

  2. The overall reaction is endothermic, so

ED>EAE_D > E_A

where EAE_A and EDE_D are the energies of reactant AA and product DD.

  1. From
ΔHi>0\Delta H_i > 0

we get

EB>EAE_B > E_A
  1. From
ΔHii<0\Delta H_{ii} < 0

we get

EC<EBE_C < E_B
  1. From
ΔHiii<0\Delta H_{iii} < 0

we get

ED<ECE_D < E_C

So the relative pattern must be such that the stable points follow an up, down, down trend from AA to BB to CC to DD, while still keeping DD above AA.

Graph 2 is the one that shows exactly this combination. Hence the correct option is B.

Common mistakes

  • Counting the number of valleys instead of the number of peaks. In a multistep reaction, the number of peaks represents the number of transition states for the elementary steps. Count three peaks here, not just the intermediates.

  • Assuming that because two steps have ΔH<0\Delta H < 0, the overall reaction must be exothermic. The problem explicitly states that ADA \rightarrow D is endothermic, so the final energy of DD must remain above that of AA.

  • Reading only the overall nature of the reaction and ignoring the signs of individual step enthalpies. The graph must satisfy both conditions: overall endothermicity and the sequence ABCDA \uparrow B \downarrow C \downarrow D.

Practice more Rate of Reaction questions

Get unlimited AI-adaptive practice, mastery tracking, and an AI tutor that explains every step — free to start.

Related questions