For a particular ideal gas, which of the following graphs represents the variation of mean squared velocity of the gas molecules with temperature?
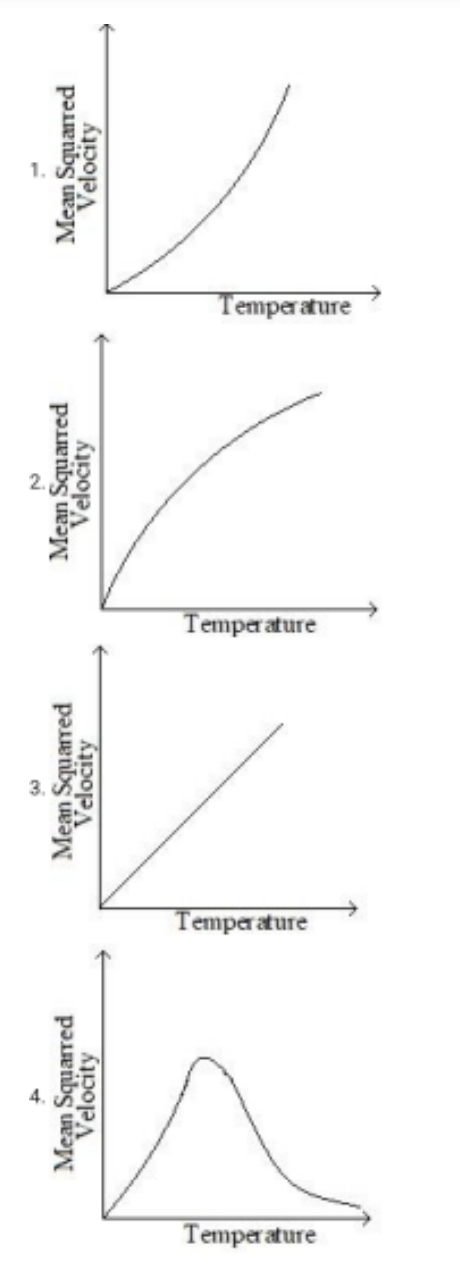
For a particular ideal gas, which of the following graphs represents the variation of mean squared velocity of the gas molecules with temperature?

Correct answer:3
Standard Method
Given: We need the graph showing variation of mean squared velocity with temperature for an ideal gas.
Find: Which graph matches the relation between mean squared velocity and temperature.
For an ideal gas,
where is the Boltzmann constant, is the temperature, and is the mass of a gas molecule.
This shows that is directly proportional to .
So the graph of mean squared velocity versus temperature must be a straight line with positive slope passing through the origin.
Therefore, the correct graph is Graph 3.
Confusing mean squared velocity with mean velocity or rms velocity. Here the relation is for , which is directly proportional to , so the graph is linear.
Choosing a curved graph by assuming speed varies as . That applies to rms speed , not to mean squared velocity. For , use direct proportionality with .
Get unlimited AI-adaptive practice, mastery tracking, and an AI tutor that explains every step — free to start.