
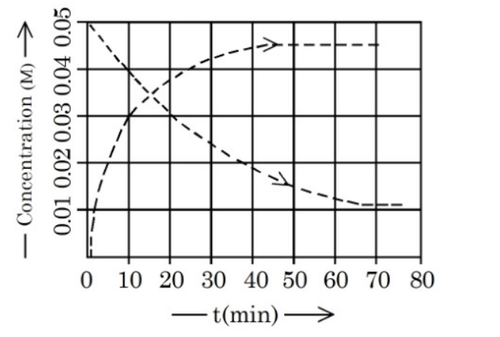
Given above is the concentration vs time plot for a dissociation reaction : . Based on the data of the initial phase of the reaction (initial ), the value of is ____.
- A
- B
- C
- D
Given above is the concentration vs time plot for a dissociation reaction : . Based on the data of the initial phase of the reaction (initial ), the value of is ____.
Correct answer:A
Standard Method
Given: The reaction is and the initial data are to be used.
Find: The value of .
From the graph, concentration of decreases from to in .
From the graph, concentration of increases from to in .
For ,
So, using the ratio of changes in the initial interval,
Therefore, the value of is and the correct option is A.
Stoichiometric Change Ratio
Given: Initial concentration changes are read from the concentration-time plot.
Find: The stoichiometric coefficient of product .
In a reaction of the form , if the stoichiometric coefficient of reactant is , then the product formed is times the reactant consumed.
During the first ,
Hence,
Therefore, the dissociation reaction is consistent with in the initial phase.
Using concentrations from later times instead of the initial interval. This is wrong because the question explicitly asks for the initial phase. Read only the concentration changes between and .
Taking as instead of . This is wrong because falls from to , so only the difference is consumed. Always subtract final from initial for reactant loss.
Inverting the ratio and using . This is wrong because for , the stoichiometric coefficient is obtained from when the coefficient of is .
Get unlimited AI-adaptive practice, mastery tracking, and an AI tutor that explains every step — free to start.