MCQEasyJEE 2026Simple Pendulum

JEE Physics 2026 Question with Solution

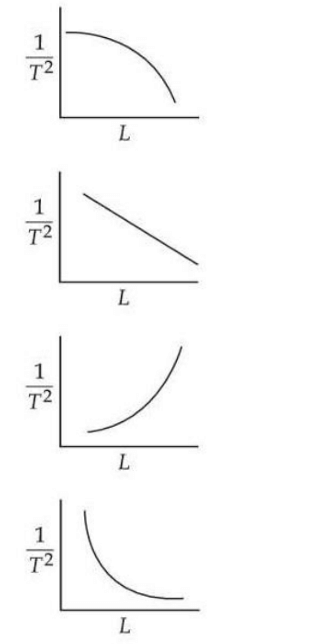
Using a simple pendulum experiment gg is determined by measuring its time period TT. Which of the following plots represent the correct relation between the pendulum length LL and time period TT?

Four candidate plots comparing pendulum quantities, with horizontal axis labeled L and vertical axis involving 1 over T squared.
  • A

    (A)

  • B

    (B)

  • C

    (C)

  • D

    (D)

Answer

Correct answer:D

Step-by-step solution

Standard Method

Given: For a simple pendulum, the time period is related to length by

T=2πLgT = 2\pi\sqrt{\frac{L}{g}}

Find: Which plot correctly represents the relation between LL and 1T2\dfrac{1}{T^2}.

Squaring both sides,

T2=4π2LgT^2 = \frac{4\pi^2 L}{g}

Taking reciprocal,

1T2=g4π21L\frac{1}{T^2} = \frac{g}{4\pi^2} \cdot \frac{1}{L}

So,

1T21L\frac{1}{T^2} \propto \frac{1}{L}

Hence 1T2\dfrac{1}{T^2} varies inversely with LL, so the graph must be a decreasing rectangular hyperbola. Therefore, the correct option is D.

Common mistakes

  • Confusing TT with T2T^2. Since TLT \propto \sqrt{L}, the graph of TT versus LL is not linear. First square the relation before comparing with the plotted quantity.

  • Assuming 1T2\dfrac{1}{T^2} versus LL must be a straight decreasing line. From 1T21L\dfrac{1}{T^2} \propto \dfrac{1}{L}, the relation is inverse, so the graph is a rectangular hyperbola, not a line.

Practice more Simple Pendulum questions

Get unlimited AI-adaptive practice, mastery tracking, and an AI tutor that explains every step — free to start.