MCQMediumJEE Main 2025 · 4 April, Shift 2Graphs of Motion

Physics Question from JEE Main 2025 · 4 April, Shift 2

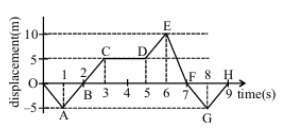
The displacement xx versus time graph is shown below.

Displacement versus time graph with points O, A, B, C, D, E, F, G, H marked from 0 to 9 seconds, showing piecewise linear motion between displacements -5 m, 0 m, 5 m, and 10 m.

(A) The average velocity during 00 to 33 s is 10m/s10 \, \text{m/s}

(B) The average velocity during 33 to 55 s is 0m/s0 \, \text{m/s}

(C) The instantaneous velocity at t=2t = 2 s is 5m/s5 \, \text{m/s}

(D) The average velocity during 55 to 77 s and the instantaneous velocity at t=6.5t = 6.5 s are equal

(E) The average velocity from t=0t = 0 to t=9t = 9 s is zero

Choose the correct answer from the options given below:

  • A

    (A),(D),(E)(A), (D), (E) only

  • B

    (B),(C),(D)(B), (C), (D) only

  • C

    (B),(D),(E)(B), (D), (E) only

  • D

    (B),(C),(E)(B), (C), (E) only

Answer & step-by-step solution

Sign in to reveal the correct answer, the full step-by-step solution, and the common mistakes for this question.

Practice more Graphs of Motion questions

Get unlimited AI-adaptive practice, mastery tracking, and an AI tutor that explains every step - free to start.

Related questions