The velocity-time graph of a body moving in a straight line is shown in the figure.
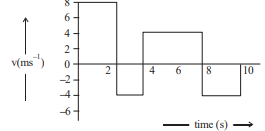
The ratio of displacement to distance travelled by the body in time to is:
- A
- B
- C
- D
The velocity-time graph of a body moving in a straight line is shown in the figure.
The ratio of displacement to distance travelled by the body in time to is:
Sign in to reveal the correct answer, the full step-by-step solution, and the common mistakes for this question.
Get unlimited AI-adaptive practice, mastery tracking, and an AI tutor that explains every step - free to start.
