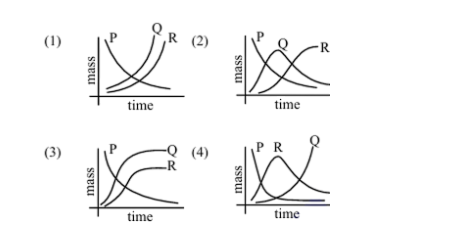
A radioactive material P first decays into Q and then Q decays to non-radioactive material R. Which of the following figure represents time dependent mass of P, Q and R?
- A
(1)
- B
(2)
- C
(3)
- D
(4)
A radioactive material P first decays into Q and then Q decays to non-radioactive material R. Which of the following figure represents time dependent mass of P, Q and R?

(1)
(2)
(3)
(4)
Correct answer:B
Standard Method
Given: A radioactive material decays into , and then decays into non-radioactive material .
Find: The correct graph showing the time-dependent masses of , and .
For the first decay,
So the mass of decreases exponentially with time.
For the intermediate product,
Thus is first produced from , so its mass initially increases, and later it decreases because it also decays into .
The mass of is
Hence the mass of increases with time.
Therefore, the correct figure must show:
This behavior matches option (2).
Therefore, the correct option is B.
Graph Behaviour Analysis
Given: , where is non-radioactive.
Find: Which graph correctly represents the masses of , and as functions of time.
Checking the figures, only option (2) shows:
Therefore, the correct option is B.
Assuming that the mass of only increases is incorrect because is both produced from and destroyed by decay into . It should first increase and then decrease.
Assuming that the mass of decreases is incorrect because is the final non-radioactive product. Its mass must accumulate with time instead of decaying away.
Treating , and as independent decays is incorrect. This is a decay chain, so the graph of each substance depends on how it is formed from the previous one.
Get unlimited AI-adaptive practice, mastery tracking, and an AI tutor that explains every step — free to start.