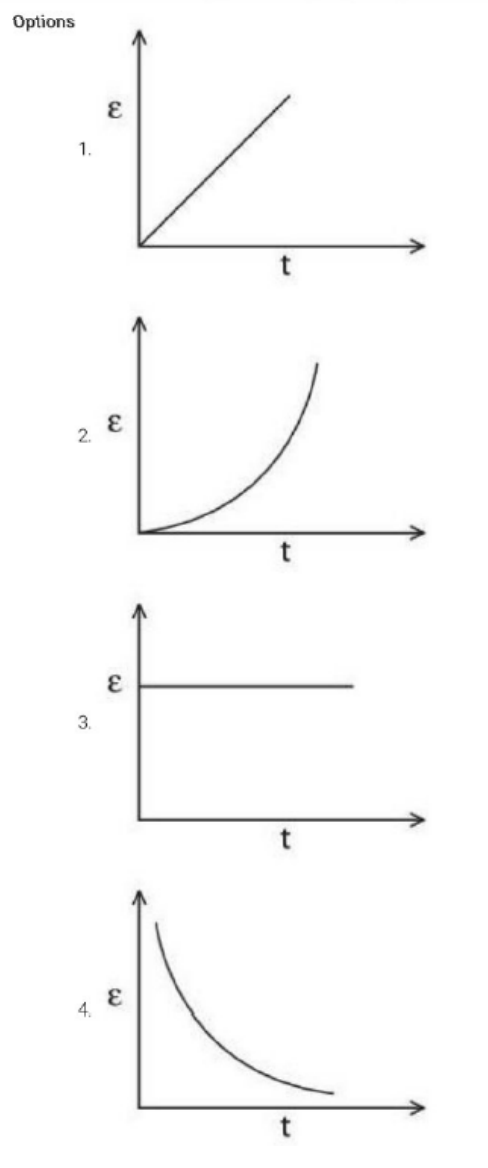
A rectangular metallic loop is moving out of a uniform magnetic field region to a field-free region with a constant speed. When the loop is partially inside the magnetic field, the plot of the magnitude of the induced emf (ε) with time (t) is given by:
A
Option 1
B
Option 2
C
Option 3
D
Option 4
Answer
Correct answer:D
Step-by-step solution
Standard Method
Given: A rectangular metallic loop moves out of a uniform magnetic field with constant speed.
Find: The correct graph of the magnitude of induced emf ∣ε∣ versus time t when the loop is partially inside the magnetic field.
Using Faraday's law:
ε=dtdΦB
When the loop is partially inside the field, the magnetic flux through it changes because the area inside the field changes with time.
If the loop moves with constant speed v, then the length leaving the field changes uniformly with time, so the area inside the field also changes uniformly. Hence,
ΦB=Blx
where B is the magnetic field, l is the side length perpendicular to motion, and x is the portion inside the field.
Differentiating with respect to time:
ε=Bldtdx=Blv
Since B, l, and v are constant, the magnitude of induced emf remains constant while the loop is partially inside the field.
Therefore, the correct graph is a horizontal line of constant magnitude. The correct option is D (Option 4).
Using flux-change interpretation
When the loop is completely inside or completely outside the magnetic field region, the flux does not change, so induced emf is zero.
During the interval in which the loop is leaving the field, the overlap area decreases linearly with time because the speed is constant. Therefore flux decreases linearly with time.
If flux varies linearly with time, then its time derivative has constant magnitude. Hence,
∣ε∣=dtdΦB=constant
So the required graph during partial overlap is the constant-emf graph, corresponding to Option 4.
Common mistakes
Assuming the emf must increase or decrease with time because the loop is moving. This is wrong because with constant speed the area inside the field changes uniformly, so the rate of change of flux is constant. Use ∣ε∣=∣dΦB/dt∣.
Confusing flux with emf. The magnetic flux changes linearly while the loop exits, but emf depends on the time derivative of flux, so its magnitude is constant, not linear.
Forgetting that the question asks for the magnitude of induced emf. The polarity may reverse for entering and leaving, but the magnitude remains positive and constant during each partial-overlap interval.
Practice more Faraday's Laws of EMI questions
Get unlimited AI-adaptive practice, mastery tracking, and an AI tutor that explains every step — free to start.