MCQEasyJEE 2023Isothermal & Adiabatic Processes

JEE Physics 2023 Question with Solution

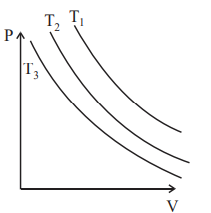
In an Isothermal change, the change in pressure and volume of a gas can be represented for three different temperatures; T3>T2>T1T_3 > T_2 > T_1 as:

  • A
    P-V graph with three curved isotherms labeled T3, T2, and T1, where the curves are rectangular hyperbolas and the labels place T1 farthest from origin.
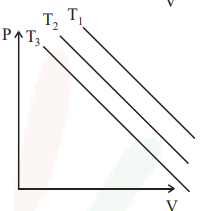
  • B
    P-V graph with three straight descending parallel lines labeled T3, T2, and T1, showing linear behavior instead of hyperbolic isotherms.
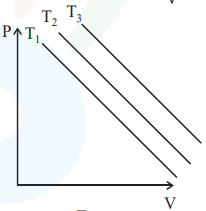
  • C
    P-V graph with three straight descending parallel lines labeled T1, T2, and T3, representing incorrect linear pressure-volume relations for isothermal processes.
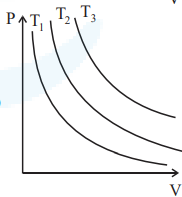
  • D
    P-V graph with three rectangular hyperbolic isotherms labeled T1, T2, and T3, with T3 farthest from origin and T1 nearest origin.

Answer

Correct answer:D

Step-by-step solution

Standard Method

Given: An isothermal change on a PP-VV graph for three temperatures satisfying T3>T2>T1T_3 > T_2 > T_1.

Find: Which graph correctly represents the pressure-volume relation.

For an isothermal process, the relation is

PV=constantPV = \text{constant}

So, the PP-VV curve is a rectangular hyperbola.

Also,

PV=nRTPV = nRT

For the same amount of gas, a higher temperature means a larger value of PVPV. Therefore, the isotherm for higher temperature lies farther from the origin on the PP-VV graph.

Since T3>T2>T1T_3 > T_2 > T_1, the outermost curve must correspond to T3T_3, the middle curve to T2T_2, and the innermost curve to T1T_1.

Therefore, the correct graph is Option D.

Using the isobaric comparison shown in the solution

Given: Three isothermal curves and the condition T3>T2>T1T_3 > T_2 > T_1.

Find: The correct ordering of curves on the PP-VV diagram.

The solution hint uses a horizontal dotted line, which represents an isobaric line, meaning pressure is the same for all three intersections.

P-V graph showing three rectangular hyperbolic isotherms labeled T1, T2, and T3 with a horizontal dotted isobaric line intersecting them; larger volume at same pressure indicates higher temperature.

At the same pressure, from the ideal gas law,

PV=nRTPV = nRT

If PP is fixed, then

VTV \propto T

Hence, larger volume means higher temperature.

Along the dotted horizontal line, the curve intersecting at the largest volume corresponds to T3T_3, then T2T_2, and then T1T_1. So the correct arrangement is the one where the hyperbolas move farther from the origin as temperature increases.

Therefore, the correct option is D.

Common mistakes

  • Mistake: Choosing a graph with straight lines. Why it is wrong: an isothermal process satisfies PV=constantPV = \text{constant}, which gives a rectangular hyperbola, not a linear relation. What to do instead: first identify the functional form of the curve before comparing labels.

  • Mistake: Reversing the temperature order and placing higher temperature closer to the origin. Why it is wrong: from PV=nRTPV = nRT, larger temperature means larger PVPV, so the curve must lie farther from the origin. What to do instead: compare curves at the same pressure or same volume.

  • Mistake: Using the incorrect statement from part of the solution text that says T1>T2>T3T_1 > T_2 > T_3. Why it is wrong: the question clearly states T3>T2>T1T_3 > T_2 > T_1. What to do instead: follow the temperature order given in the question and then place the outermost isotherm at the highest temperature.

Practice more Isothermal & Adiabatic Processes questions

Get unlimited AI-adaptive practice, mastery tracking, and an AI tutor that explains every step — free to start.

Related questions