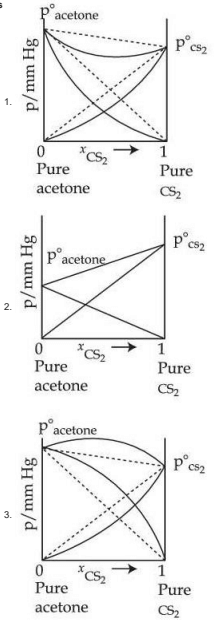
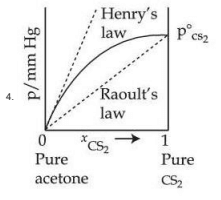
Which one of the following graphs accurately represents the plot of partial pressure of vs its mole fraction in a mixture of acetone and at constant temperature?
- A
Graph 1
- B
Graph 2
- C
Graph 3
- D
Graph 4
Which one of the following graphs accurately represents the plot of partial pressure of vs its mole fraction in a mixture of acetone and at constant temperature?


Graph 1
Graph 2
Graph 3
Graph 4
Correct answer:A
Standard Method
Given: A mixture of acetone and at constant temperature.
Find: Which graph represents the plot of partial pressure of versus its mole fraction.
A mixture of acetone and carbon disulfide () shows positive deviation from Raoult's law because the intermolecular attractions between acetone- are weaker than acetone-acetone or **-CS_2
In a solution showing positive deviation:
Positive deviation is often associated with
and
So, the correct graph is the one showing positive deviation for partial pressure, which is Graph 1.
Therefore, the correct option is A.
Why positive deviation occurs
Given: Acetone and form a non-ideal solution.
Find: The correct qualitative shape of the versus graph.
When unlike molecular interactions are weaker than like molecular interactions, molecules escape more easily into the vapour phase. Hence the observed partial pressure becomes greater than the value predicted by Raoult's law.
Thus, instead of following a linear relation,
the actual curve lies above the Raoult's law line and bends upward.
So the graph corresponding to upward deviation is selected.
Therefore, the correct option is A.
Assuming the solution obeys Raoult's law exactly. This is wrong because acetone- interactions are weaker, so the mixture shows positive deviation. Look for an upward-bowed curve, not a straight line.
Confusing positive deviation with negative deviation. In negative deviation, stronger unlike interactions lower vapour pressure. Here the vapour pressure is higher than ideal, so the curve must lie above the Raoult's law line.
Choosing the graph from total vapour pressure behaviour instead of partial pressure of . The question specifically asks for versus , so identify the component curve correctly.
Get unlimited AI-adaptive practice, mastery tracking, and an AI tutor that explains every step — free to start.