
Let and be the distances of the object and the image from a lens of focal length . The correct graphical representation of and for a convex lens when , is:
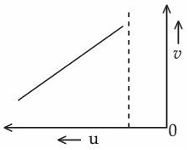
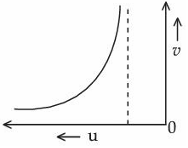
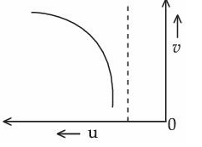
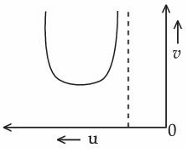
- A
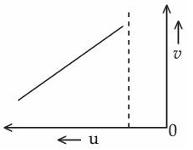
- B
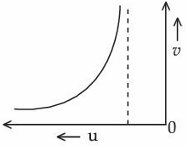
- C
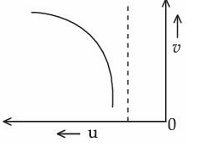
- D
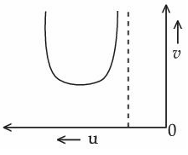
Let and be the distances of the object and the image from a lens of focal length . The correct graphical representation of and for a convex lens when , is:
Correct answer:B
Standard Method
Given: A convex lens with object distance , image distance , and focal length , with .
Find: The correct graph relating and .
Using the lens formula:
Rearranging,
Hence,
This is not a linear relation. It represents a hyperbolic or inverse-type relation between and .
As varies for , the denominator controls the rapid change in , so the graph is an inverse curve rather than a straight line or a parabola.
Therefore, the correct option is B.
Detailed Graph Interpretation
Given: The relation between object distance and image distance for a convex lens.
Find: Which of the four graphs correctly represents the variation when .
The lens formula is:
Multiplying through and rearranging gives:
or
This equation shows that depends on through a rational expression, so the graph is a rectangular-hyperbola-type curve.
Thus:
So the inverse graph shown in the second figure matches the required relation. Therefore, the correct option is B.
Assuming the relation between and is linear because both are distances is incorrect. The lens formula gives a rational relation, so the graph must be hyperbolic. Use before judging the graph.
Ignoring the condition leads to choosing a graph that does not match the physical image formation region. First apply the focal-length restriction, then study the behavior of the curve.
Confusing sign convention with graphical shape is a conceptual error. Even though signs matter in optics, the functional dependence here still comes from the lens equation, so identify the algebraic form of the curve first.
Get unlimited AI-adaptive practice, mastery tracking, and an AI tutor that explains every step — free to start.