
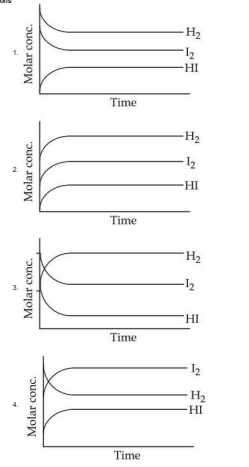
For the reaction, Attainment of equilibrium is predicted correctly by:
- A
Graph
- B
Graph
- C
Graph
- D
Graph
For the reaction, Attainment of equilibrium is predicted correctly by:
Graph
Graph
Graph
Graph
Correct answer:C
Standard Method
Given: The reaction is .
Find: Which graph correctly shows attainment of equilibrium.
At equilibrium, the concentrations of reactants and products become constant, and the rates of the forward and reverse reactions become equal.
For this reaction, the concentrations of the reactants and decrease with time, while the concentration of the product increases with time. As equilibrium is attained, all three concentrations become constant.
Therefore, the correct graph is the one in which and decrease and level off, while increases and levels off.
The correct option is C.
Stepwise Interpretation
Given: The reaction is .
Find: The graph that correctly represents attainment of equilibrium.
Final Answer: Option (3), so the correct option is C.
Assuming equilibrium means equal concentrations of , , and . This is incorrect because equilibrium requires constant concentrations, not necessarily equal concentrations. Look for curves that level off, not curves that meet at the same value.
Confusing equality of reaction rates with zero concentrations change from the start. The concentrations change until equilibrium is reached; only after that do they become constant. Choose the graph where the curves change first and then flatten.
Get unlimited AI-adaptive practice, mastery tracking, and an AI tutor that explains every step — free to start.