
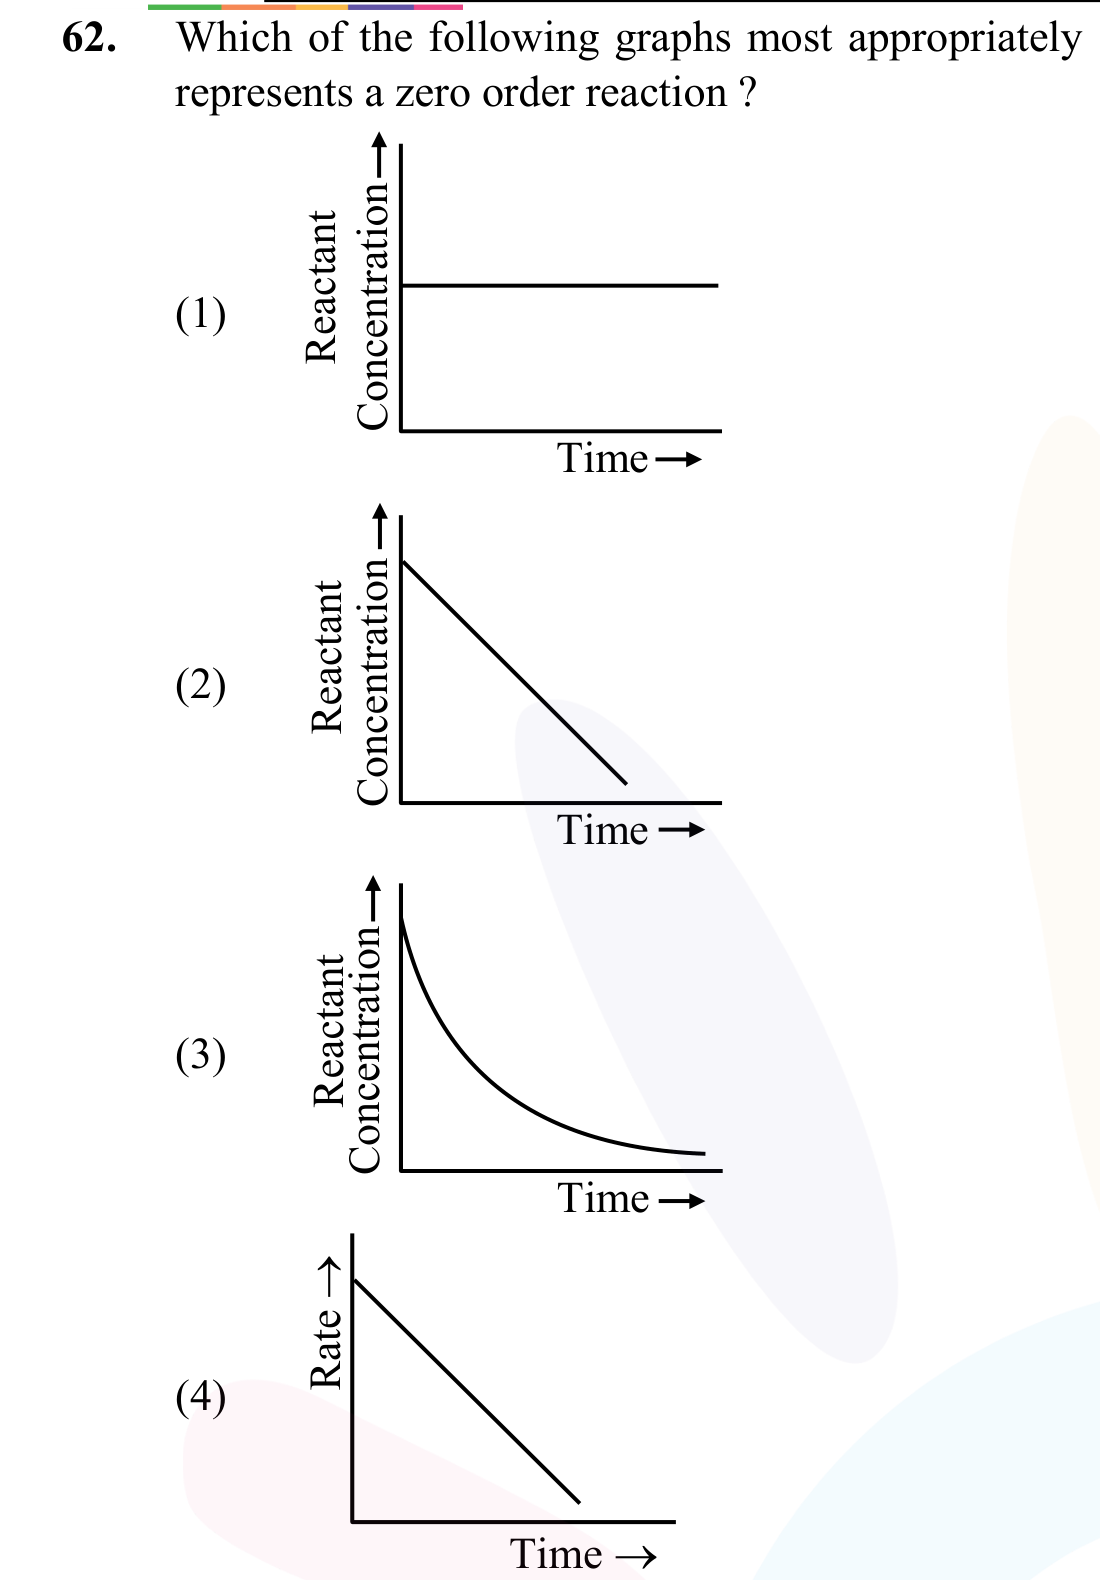
Which of the following graphs most appropriately represents a zero-order reaction?
- A
(1)
- B
(2)
- C
(3)
- D
(4)
Which of the following graphs most appropriately represents a zero-order reaction?
(1)
(2)
(3)
(4)
Correct answer:B
Standard Method
Given: A graph-based question on a zero-order reaction.
Find: Which graph correctly represents the behavior of a zero-order reaction.
For a zero-order reaction, the rate is constant and does not depend on reactant concentration:
The integrated rate law is:
This is the equation of a straight line:
So, a plot of reactant concentration versus time must be a straight line with negative slope and intercept .
Therefore, the correct graph is the one showing reactant concentration decreasing linearly with time, which is option (2).
The correct option is B.
Other graphs are incorrect because a horizontal concentration-time graph would imply no reaction progress, a curved concentration-time graph corresponds to a different order, and a decreasing rate-time straight line does not represent zero-order behavior since the rate remains constant in zero-order kinetics.
Using the Integrated Rate Law
Given: Zero-order kinetics.
Find: The appropriate graph.
In zero-order kinetics, the rate law is:
Hence the rate remains constant throughout the reaction.
Using the integrated form:
we see that reactant concentration decreases by equal amounts in equal intervals of time. Therefore, the graph of against is linear with a negative slope.
So the graph marked (2) matches zero-order behavior, and hence the correct option is B.
Confusing rate versus time with concentration versus time. In zero-order kinetics, the rate stays constant, but the concentration decreases linearly. Check which quantity is plotted on each axis before choosing the graph.
Assuming any decreasing curve represents a zero-order reaction. A curved fall in concentration with time is typical of non-zero-order behavior. For zero order, use the integrated law , which gives a straight line.
Thinking that a horizontal concentration-time graph is correct because the rate is constant. Constant rate does not mean constant concentration; it means concentration decreases at a constant rate. Therefore, the concentration-time graph must slope downward linearly.
Get unlimited AI-adaptive practice, mastery tracking, and an AI tutor that explains every step — free to start.