MCQMediumJEE 2025Order & Molecularity

JEE Chemistry 2025 Question with Solution

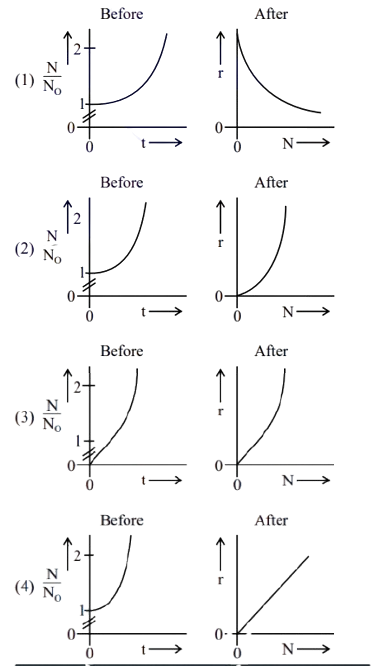
A person's wound was exposed to some bacteria and then bacteria growth started to happen at the same place. The wound was later treated with some antibacterial medicine and the rate of bacterial decay (rr) was found to be proportional with the square of the existing number of bacteria at any instance. Which of the following set of graphs correctly represents the 'before' and 'after' situation of the application of the medicine?

[Given: NN = No. of bacteria, tt = time, bacterial growth follows 11st order kinetics.]

Four options of paired graphs labeled Before and After, comparing bacterial growth versus time and decay rate versus number of bacteria.
  • A

    (1)

  • B

    (2)

  • C

    (3)

  • D

    (4)

Answer

Correct answer:B

Step-by-step solution

Standard Method

Given: Bacterial growth before treatment follows first-order kinetics. After treatment, the rate of bacterial decay is proportional to the square of the number of bacteria.

Find: The correct set of before and after graphs.

For bacterial growth before treatment,

dNdt=kN\frac{dN}{dt} = kN

So,

N=N0ektN = N_0 e^{kt}

This represents an exponential increase of NN with tt. Therefore, the before graph must be an exponentially rising curve.

After treatment, decay follows

dNdt=rN2\frac{dN}{dt} = -rN^2

So the decay rate magnitude is proportional to

rN2r \propto N^2

Hence, the graph of rr versus NN must increase non-linearly as NN increases. This gives an upward-curving graph, not a straight line or a decreasing curve.

Selected correct pair of graphs: before shows exponential rise of N by N0 versus time, after shows upward curving increase of decay rate r versus N.

Thus, the correct set is the one with an exponential rise before treatment and a curved increasing rr versus NN graph after treatment.

Therefore, the correct option is B.

Detailed Reasoning

Given:

  • Before treatment, bacterial growth follows first-order kinetics.
  • After treatment, bacterial decay rate is proportional to the square of the existing bacteria.

Find: Which graphical option matches both situations.

Before treatment, first-order growth means the rate is directly proportional to the number present:

dNdt=kN\frac{dN}{dt} = kN

Integrating gives

N=N0ektN = N_0 e^{kt}

So NN0\frac{N}{N_0} versus tt shows exponential growth.

After treatment, the statement says the decay rate is proportional to the square of bacteria count:

rN2r \propto N^2

Therefore, when plotted against NN, the rate rr must rise like a parabola-type curve from the origin.

Checking the options:

  • Option A has a decreasing after curve, so it does not represent rN2r \propto N^2.
  • Option B has exponential increase before treatment and a curved increasing after graph.
  • Option C has a linear after graph, which is inconsistent with square dependence.
  • Option D also shows a linear after graph.

Therefore, the correct option is B.

Common mistakes

  • Confusing first-order growth with linear growth. First-order kinetics gives an exponential curve, not a straight line. Use N=N0ektN = N_0 e^{kt} for the before graph.

  • Assuming that decay means the graph of rr versus NN must decrease. Here the statement is about the rate of decay being proportional to N2N^2, so the value of rr increases with NN.

  • Treating rN2r \propto N^2 as rNr \propto N. That would produce a straight-line graph, which is incorrect. A square dependence gives a non-linear upward curve instead.

Practice more Order & Molecularity questions

Get unlimited AI-adaptive practice, mastery tracking, and an AI tutor that explains every step — free to start.

Related questions