
The resistivity () of a semiconductor varies with temperature. Which of the following curves represents the correct behavior?
- A
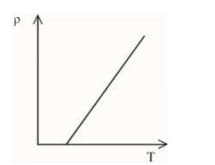
- B
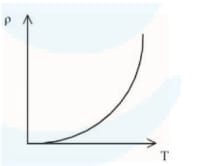
- C
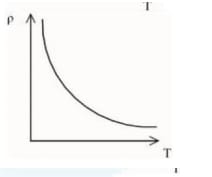
- D
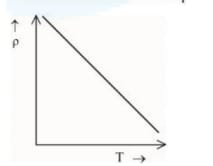
The resistivity () of a semiconductor varies with temperature. Which of the following curves represents the correct behavior?
Correct answer:C
Standard Method
Given: The variation of resistivity of a semiconductor with temperature is asked through graphs.
Find: Which graph correctly represents how changes with increasing .
For a semiconductor,
As temperature increases, the relaxation time decreases, but the carrier concentration increases significantly. The effect of increase in dominates over the decrease in .
Therefore, the resistivity decreases as temperature increases.
So, the correct graph is the one in which decreases with increasing . The correct option is C.
Confusing a semiconductor with a metallic conductor. In metals, resistivity usually increases with temperature, but in semiconductors the carrier concentration increases strongly with temperature. Use semiconductor carrier behavior, not metallic behavior.
Focusing only on the decrease of with temperature. Although decreases, the increase in carrier concentration is the dominant effect. Consider both factors in .
Get unlimited AI-adaptive practice, mastery tracking, and an AI tutor that explains every step — free to start.