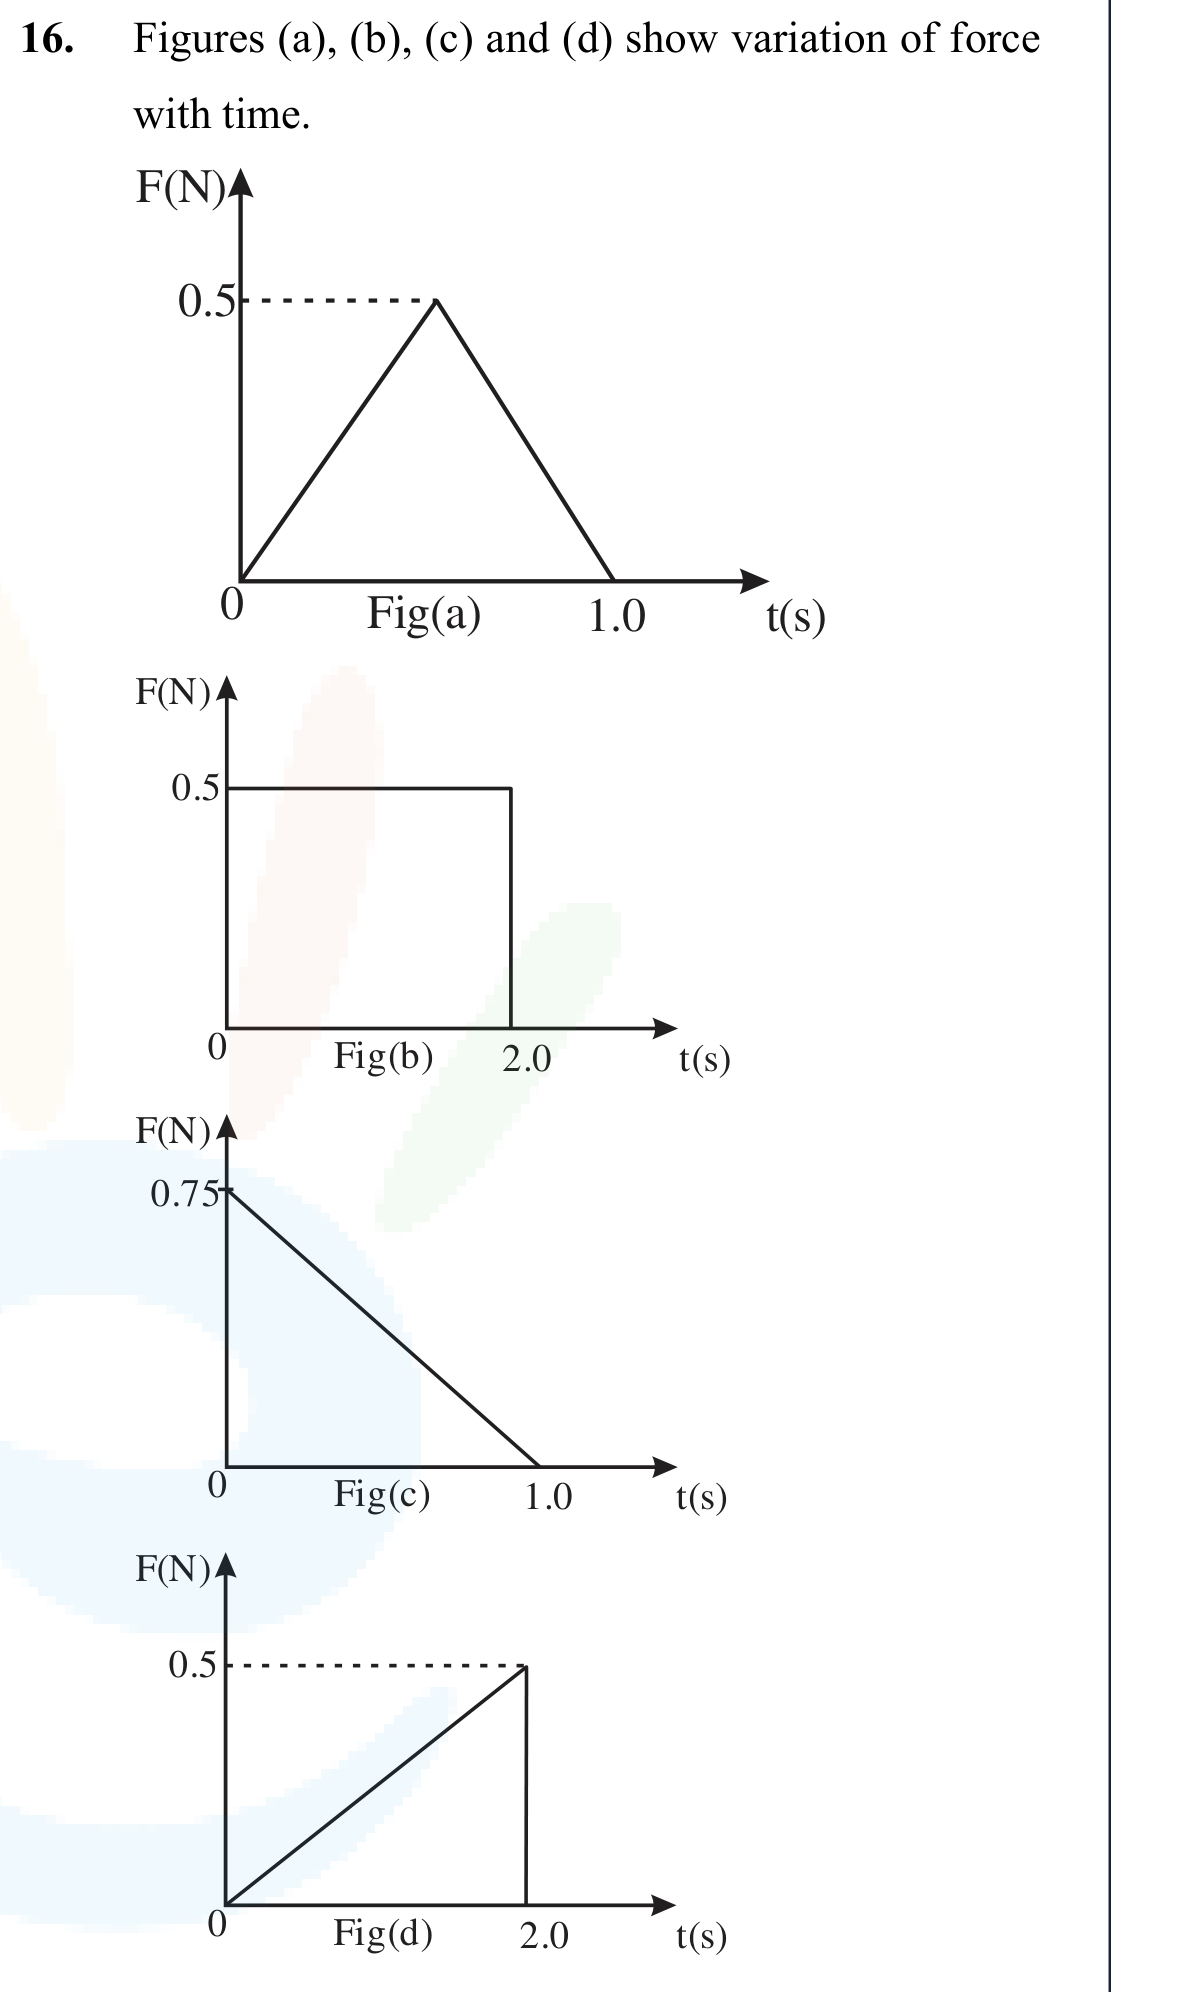
Figures (a), (b), (c) and (d) show variation of force with time. The impulse is highest in figure:
- A
Fig (c)
- B
Fig (b)
- C
Fig (a)
- D
Fig (d)
Figures (a), (b), (c) and (d) show variation of force with time. The impulse is highest in figure:
Fig (c)
Fig (b)
Fig (a)
Fig (d)
Sign in to reveal the correct answer, the full step-by-step solution, and the common mistakes for this question.
Get unlimited AI-adaptive practice, mastery tracking, and an AI tutor that explains every step - free to start.
