
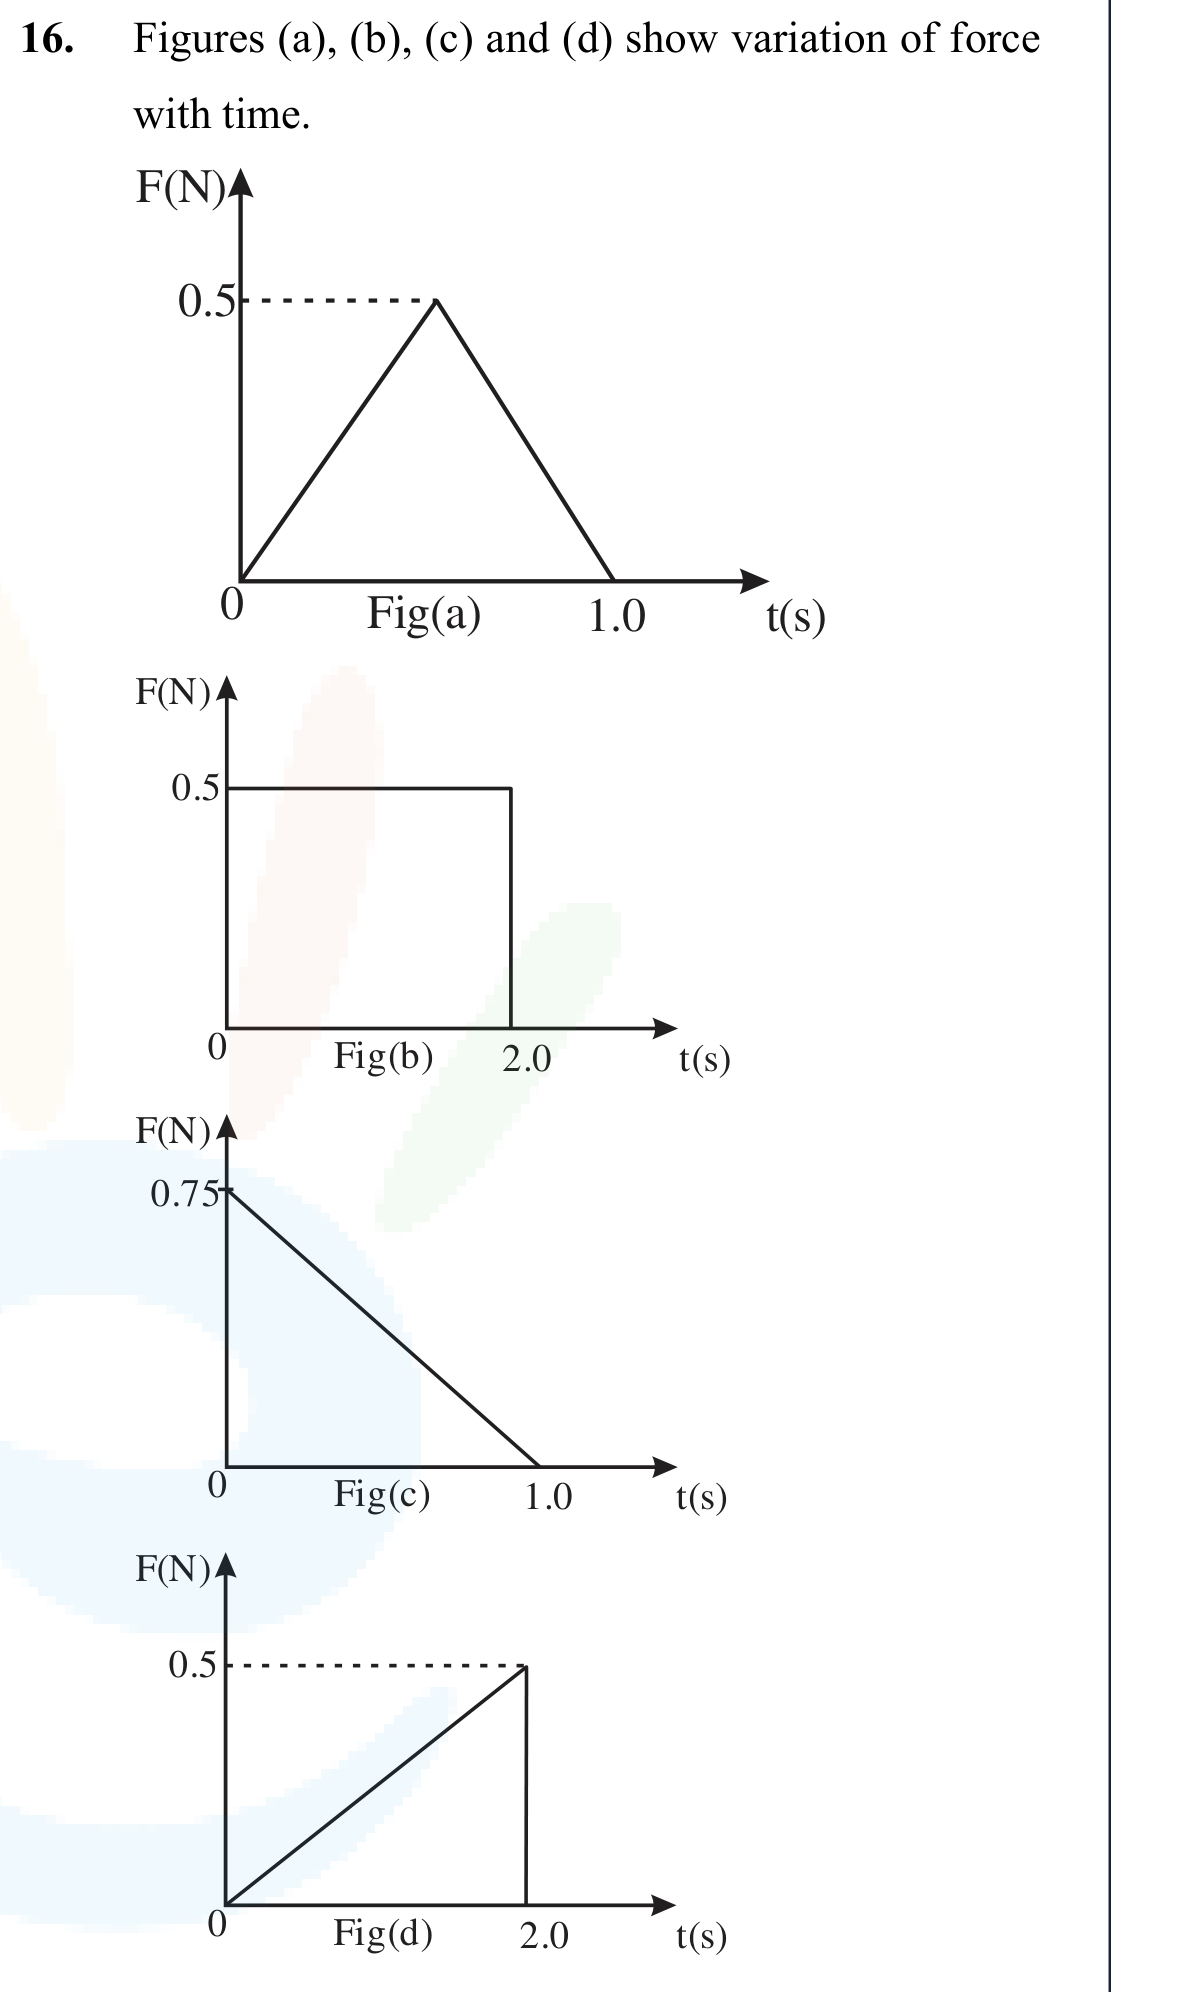
Figures (a), (b), (c) and (d) show variation of force with time. The impulse is highest in figure:
- A
Fig (c)
- B
Fig (b)
- C
Fig (a)
- D
Fig (d)
Figures (a), (b), (c) and (d) show variation of force with time. The impulse is highest in figure:
Fig (c)
Fig (b)
Fig (a)
Fig (d)
Correct answer:B
Standard Method
Given: Four force-time graphs are shown.
Find: Which figure has the highest impulse.
Impulse is equal to the area under the force-time graph.
For Fig (a):
For Fig (b):
For Fig (c):
For Fig (d):
Comparing all values, the highest impulse is for Fig (b).
Therefore, the correct option is B.
Treating impulse as the maximum force instead of the area under the force-time graph is incorrect. A taller graph does not always mean a larger impulse. Always compare the total enclosed area.
Using the triangle area formula for every graph is wrong because Fig (b) is a rectangle. Identify the shape first, then apply the correct area formula.
Ignoring the time duration leads to an incorrect comparison. Impulse depends on both force and time, so a smaller force acting for longer time can produce a larger impulse.
Get unlimited AI-adaptive practice, mastery tracking, and an AI tutor that explains every step - free to start.