
The figures below show:
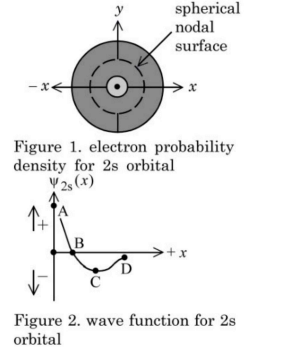
Which of the following points in Figure 2 most accurately represents the nodal surface shown in Figure 1?
- A
C
- B
D
- C
B
- D
A
The figures below show:
Which of the following points in Figure 2 most accurately represents the nodal surface shown in Figure 1?
C
D
B
A
Correct answer:C
Standard Method
Given: Figure 1 shows the orbital with a spherical nodal surface. Figure 2 shows the wave function with labeled points , , , .
Find: Which point in Figure 2 represents the nodal surface shown in Figure 1.
Concept: A node is a region where the wave function becomes exactly zero. For hydrogen-like orbitals, the number of radial nodes is
For the orbital,
So,
Thus, the orbital has one spherical nodal surface.
Electron probability density is proportional to , but the nodal surface is identified by
not merely by a low probability.
From Figure 2:
Therefore, the nodal surface corresponds to the zero-crossing of the wave function, which is point B.
The correct option is C.
Wave Function Interpretation
Given: The question compares a spherical nodal surface in Figure 1 with the graph of in Figure 2.
Find: The point on the graph where the nodal surface is represented.
A spherical nodal surface in the orbital means that at a particular radius,
When this same behavior is shown along a single axis, the node appears where the plotted wave function crosses the -axis.
In Figure 2, only point lies on the axis where
Hence, the spherical nodal surface in Figure 1 corresponds to point B in Figure 2.
Therefore, the correct option is C.
Choosing the point where probability is minimum instead of where the wave function is zero. A node is defined by , not by a small value of . Always identify the zero-crossing of the wave function.
Confusing point C with the node because it is the lowest point on the graph. A minimum negative value is still non-zero, so it is not a node. Check whether the graph actually crosses the axis.
Using the orbital picture incorrectly and not connecting it to the graph. The spherical nodal surface in the orbital corresponds to a specific radius where . On a one-dimensional plot, this appears as the axis-crossing point.
Get unlimited AI-adaptive practice, mastery tracking, and an AI tutor that explains every step — free to start.