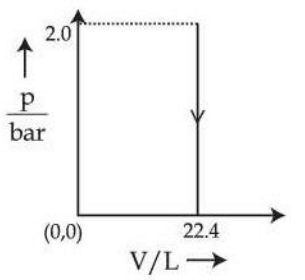
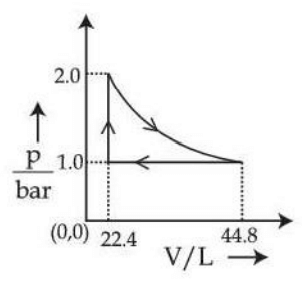
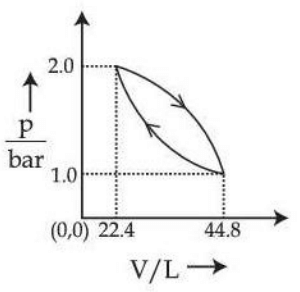
Which of the following graphs between pressure versus volume represents the maximum work done?
- A
- B
- C
- D
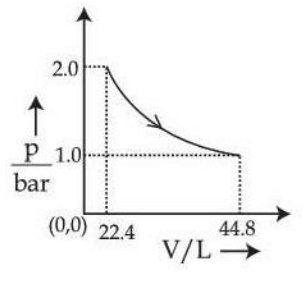
Which of the following graphs between pressure versus volume represents the maximum work done?


Correct answer:D
Standard Method
Given: We must identify which - graph represents the maximum work done.
Find: The correct option corresponding to the largest work.
For a process, work done is given by
So, the magnitude of work is equal to the area under the - curve. For a cycle, work is the enclosed area.
From the given graphs:
Therefore, the graph representing the maximum work done is Graph 4.
The correct option is D.
Confusing work done in a cycle with work done in an open expansion process. For a cycle, work is the enclosed area, but for an expansion process it is the area under the curve. Always identify the type of process first.
Looking only at the shape of the curve and not at the actual area. A more complex-looking graph does not imply larger work; compare the area represented on the - diagram.
Ignoring the volume interval. Work depends on , so both pressure and the change in volume matter. A graph spanning a larger volume range can produce greater work.
Get unlimited AI-adaptive practice, mastery tracking, and an AI tutor that explains every step — free to start.