MCQEasyJEE 2025Resistivity & Conductivity

JEE Physics 2025 Question with Solution

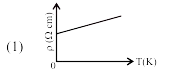
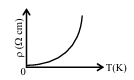
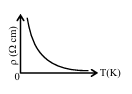
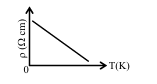
Which of the following resistivity (ρ\rho) vs temperature (TT) curves is most suitable to be used in wire-bound standard resistors?

  • A
    Graph of resistivity rho in ohm centimetre versus temperature T in kelvin, showing an almost horizontal line with slight positive slope.
  • B
    Graph of resistivity rho in ohm centimetre versus temperature T in kelvin, showing a curve rising steeply upward with increasing temperature.
  • C
    Graph of resistivity rho in ohm centimetre versus temperature T in kelvin, showing a rapidly decreasing curve that flattens near the temperature axis.
  • D
    Graph of resistivity rho in ohm centimetre versus temperature T in kelvin, showing a straight line decreasing linearly with temperature.

Answer

Correct answer:A

Step-by-step solution

Standard Method

Given: We need the most suitable ρ\rho vs TT curve for wire-bound standard resistors.

Find: Which graph corresponds to a material whose resistivity stays nearly constant with temperature.

For a standard resistor, the resistance should remain as stable as possible when temperature changes. Therefore, the material should have a very small temperature coefficient of resistivity.

That means the resistivity ρ\rho should show minimal variation as temperature TT changes. So the required graph must be nearly horizontal.

Among the given curves, Option A shows resistivity remaining almost constant with temperature.

Therefore, the correct option is A.

Concept-Based Explanation

Given: In wire-bound standard resistors, accurate and consistent resistance is required over temperature changes.

Find: The most appropriate ρ\rho-vs-TT curve.

If resistivity changes significantly with temperature, then the resistance of the wire also changes, which makes it unsuitable as a standard resistor.

So the ideal material should satisfy:

ρconstant with T\rho \approx \text{constant with } T

This corresponds to a graph that is approximately a horizontal line.

The solution text states that the curve with almost no noticeable change in resistivity is the best choice. Hence the suitable curve is the one shown in Option 1, which maps to Option A.

Therefore, the correct option is A.

Common mistakes

  • Choosing a graph with a large positive slope because metals usually have increasing resistivity with temperature is incorrect here. A standard resistor must have resistivity that changes as little as possible. Look for near-constant ρ\rho, not merely a metallic trend.

  • Assuming any slowly changing graph is acceptable is incorrect. Even a noticeable rise or fall in ρ\rho with TT changes the resistance value. The correct choice should be the graph with minimum variation in resistivity.

  • Confusing resistance with resistivity can lead to the wrong choice. The graph directly shows ρ\rho versus TT, and for a standard resistor the underlying material itself should have a very small temperature coefficient. Focus on material property stability.

Practice more Resistivity & Conductivity questions

Get unlimited AI-adaptive practice, mastery tracking, and an AI tutor that explains every step — free to start.

Related questions