MCQEasyJEE Main 2023 · 6 April, Shift 1Semiconductors Basics

Physics Question from JEE Main 2023 · 6 April, Shift 1

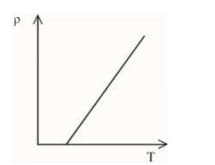
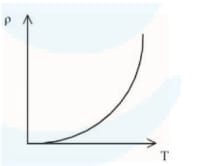
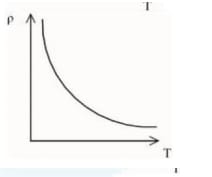
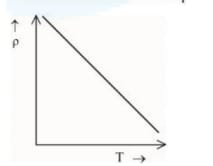
The resistivity (ρ\rho) of a semiconductor varies with temperature. Which of the following curves represents the correct behavior?

  • A
    Graph of resistivity $$\rho$$ versus temperature $$T$$ showing a straight line increasing upward from left to right after a small positive temperature intercept.
  • B
    Graph of resistivity $$\rho$$ versus temperature $$T$$ showing a curved increase upward from left to right, becoming steeper at higher temperature.
  • C
    Graph of resistivity $$\rho$$ versus temperature $$T$$ showing a decreasing curve that falls rapidly first and then gradually flattens as temperature increases.
  • D
    Graph of resistivity $$\rho$$ versus temperature $$T$$ showing a straight line decreasing downward from left to right toward zero as temperature increases.

Answer & step-by-step solution

Sign in to reveal the correct answer, the full step-by-step solution, and the common mistakes for this question.

Practice more Semiconductors Basics questions

Get unlimited AI-adaptive practice, mastery tracking, and an AI tutor that explains every step - free to start.

Related questions